We’ve gathered the 74 top renewable energy statistics from reliable third-party sources to provide a data-driven view of the industry. These statistics cover everything from renewable energy consumption to public opinions on its adoption.
Top Renewable Energy Statistics (Editor’s Pick)
This shortlist of key renewable energy statistics highlights the potential, adoption progress, and financial and policy shifts crucial for future sustainability goals.
- Utility-scale photovoltaic (PV) solar has the highest technical energy production potential in the U.S., with a capacity of 157,765 GW and a potential annual production of 297,486 TWh.
- Enhanced Geothermal Systems (EGS) have a total energy potential of 24,638 TWh per year.
- The share of modern renewables increased from 8.7% in 2009 to 12.6% in 2020.
- In 2022, 22.5% of the energy consumed in the EU came from renewable sources, reflecting the region’s transition toward cleaner energy.
- Fossil fuel subsidies in 2020 reached $5.9 trillion, equivalent to $11 million per minute globally.
- The world will need three times more renewable energy capacity by 2030, amounting to at least 11,000 GW of renewable capacity.
- Global clean energy investments will need to more than triple, reaching $4 trillion annually by 2030, to achieve net zero emissions by 2050.
- A total of 156 countries now have renewable power regulatory policies in place.
- One hundred thirty-five countries now have renewable power targets, and 156 countries have renewable power regulatory policies.
Renewable Energy Sources
The transition toward renewable energy is accelerating, with countries and businesses alike investing heavily in clean energy solutions. Solar power, wind energy, hydropower, and other renewable sources are growing in capacity and potential every year.
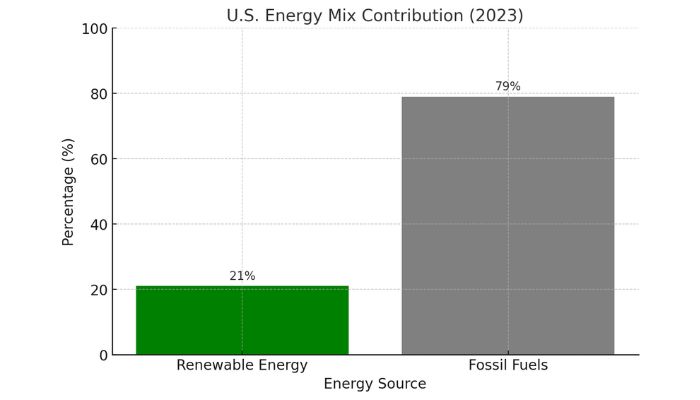
As of 2023, renewable energy contributed to over 21% of U.S. With costs for solar and wind power continuing to fall and public support growing, it’s clear that renewable energy will play a dominant role in our future energy mix.
It’s clear from the following 41 statistics that renewable energy is the future of global energy.
Solar
- Utility-scale photovoltaic (PV) solar has the highest technical energy production potential in the U.S., with a capacity of 157,765 GW and a potential annual production of 297,486 TWh.
- Concentrating Solar Power (CSP) has a potential capacity of 16,691 GW and an annual production potential of 87,728 TWh in the U.S.
- Distributed PV (mainly rooftop solar) has a lower capacity of 1,118 GW but still offers 1,432 TWh of potential annual production in the U.S.
- Within 10 miles of tribal lands in the U.S., utility-scale PV solar has the highest potential, with 22,736 TWh per year, while CSP can provide 14,703 TWh per year.
- In 2020, U.S. energy production from utility-scale PV was 88 TWh, a small fraction of its 297,486 TWh technical potential.
- There is a high concentration of utility-scale PV potential in the southwestern U.S., with Arizona, New Mexico, and California leading in production capacity, reaching up to 9,000 TWh per year.
- Distributed PV potential is widespread, with southern states showing the highest potential to offset electricity consumption for low-to-moderate-income households.
- As of 2019, California had the most installed utility PV capacity at 10,712 MW, followed by states like Texas and North Carolina.
- Forty-seven percent of homeowners have either seriously considered installing or have already installed solar panels. Homeowners in the Pacific region of the West lead with 62%, followed by the Mountain region at 51%.
- The Midwest has the lowest solar panel installation consideration, with 40% of homeowners thinking about or already installing solar panels.
- A significant majority (72%) of U.S. adults believe the government should encourage wind and solar power production.
- The levelized costs of onshore wind power and solar PV are now cheaper on average than fossil fuels.
- More than 50% of climate mitigation finance is allocated to hydropower, solar PV, and wind power.
- The share of solar and wind power in renewable energy for electricity generation grew significantly, from 2% to 10% over the same period.
- The share of renewable heat grew to 4.8%, while biomass, geothermal, solar, and wind provided 2.8% of other renewables by 2020.
- By 2050, the energy sector will be largely renewable-based, with solar energy becoming the single largest source of supply. This transition will require singular, unwavering focus from all governments, along with collaboration from businesses, investors, and citizens.
- In 2023, the U.S. produced 4.18 trillion kWh of electricity, with about 21% coming from renewable sources. Small-scale solar systems alone contributed 73.62 billion kWh to the total.
- In 2023, solar PV alone contributed to three-quarters of all renewable capacity additions globally.
- Globally, wind and solar power grew from just 32 TWh in 2000 to over 2,400 TWh in 2020, enough to power the entire country of India.
Wind
- In the U.S., land-based wind has a potential capacity of 9,124 GW and a production potential of 24,774 TWh per year.
- Offshore wind potential in the U.S. has a capacity of 5,075 GW and a production potential of 19,290 TWh per year. Distributed wind, typically small-scale turbines, adds an additional 4,400 TWh per year.
- Wind-based resources near tribal lands in the U.S. show high potential, especially land-based wind, which could contribute 4,940 TWh per year.
- In 2020, U.S. land-based wind produced 338 TWh, far below its potential of 24,774 TWh.
- A significant majority (72%) of U.S. adults believe the government should encourage wind and solar power production.
- In 2022, wind energy contributed over 7% of global electricity and more than 10% of U.S. utility-scale electricity generation. Meanwhile, hydroelectric power accounted for more than 18% of the world’s total power generation capacity in 2019, making it the most widely utilized form of renewable energy at that time.
- Wind power has one of the greatest potentials for renewable capacity growth, surpassing nuclear power in electricity generation by 2025.
Geothermal
- Enhanced geothermal systems (EGS) and hydrothermal geothermal energy have a combined potential capacity of 3,401 GW, with a technical production potential of 24,638 TWh per year in the U.S.
- Enhanced Geothermal Systems (EGS) have a total energy potential of 24,638 TWh per year. These systems capture heat from beneath the Earth’s surface to generate electricity and remain largely untapped.
- Hydrothermal geothermal technology is more mature, with several plants operating in the western U.S. Hydrothermal geothermal systems have a potential capacity of 24 GW and a production capacity of 181 TWh per year.
- In U.S. 2020, EGS generated 0 TWh, while hydrothermal systems generated 17 TW.
Biomass
- Biomass has a capacity of 71 GW, offering a potential annual production of 505 TWh and currently contributes 56 TWh per year to U.S. energy production.
- Biomass energy has remained relatively flat, contributing about 56 TWh per year to U.S. electricity generation in 2020, despite significant installed capacity.
Hydropower
- In 2020, U.S. hydropower was one of the few renewable sources utilizing a significant portion of its potential, producing 291 TWh out of 661 TWh.
- There are numerous non-powered dams across the U.S. with significant hydropower potential. These dams currently do not generate electricity but could do so if retrofitted with power-generating equipment.
- Traditional water-based energy production from dams and rivers in the U.S. has a potential production of 661 TWh per year, with 291 TWh per year already being produced.
- The share of hydropower in electricity generation remained stable, shifting from around 16% to 15% from 2011 to 2021.
- Hydropower accounted for 3.9% of final energy consumption, and biofuels contributed 1% for transport in 2020.
- By 2028, hydropower is expected to remain the largest source of renewable electricity worldwide.
Ocean Energy
- Ocean energy has the potential to generate 2,300 TWh per year from wave, tidal, and current energy resources off U.S. shores. Despite this large potential, 0 TWh of energy was produced from ocean energy in 2020. Ocean energy is still in its early stages, with only a few pilot projects in operation.
- The term “ocean energy” is becoming more common in the industry, replacing the older term “marine energy.”
Sources: Energy, IEA, REN21, Britannica, PewResearch, EIA, Climate, IEA
Global Energy Transition and Consumption
The future of energy depends on increasing clean energy capacity, reducing CO2 emissions, and making significant investments in energy efficiency. Governments, businesses, and individuals will all play a role in shaping this transition.
In regions like the EU, renewable energy has become a major part of the energy mix.
Energy Transition & Public Opinion
- Thirty percent of U.S. adults believe the transition to renewable energy will very likely lead to unexpected problems for the country, while 40% think it is somewhat likely.
- Thirty-nine percent of U.S. adults feel that the U.S. has a responsibility to help developing countries build renewable energy infrastructure. Fifty-nine percent of Democrats agree with this responsibility, compared to only 18% of Republicans.
Global Energy Consumption and Transition
- The share of modern renewables increased from 8.7% in 2009 to 12.6% in 2020.
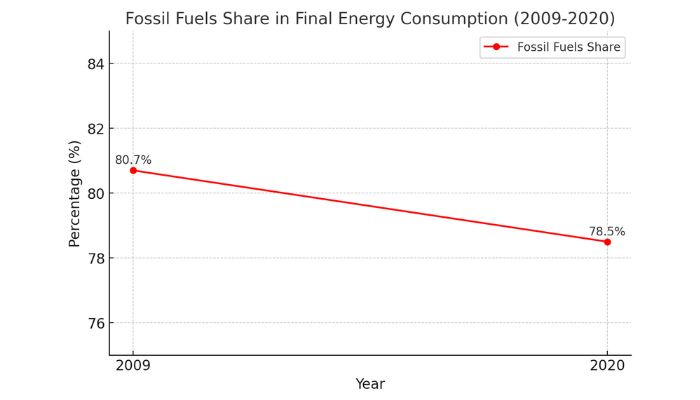
- The share of fossil fuels in final energy consumption remained largely unchanged, decreasing only slightly from 80.7% in 2009 to 78.5% in 2020.
- According to the U.S. Environmental Protection Agency, 11% of the nation’s energy consumption came from renewable resources in 2017.
- In 2022, 22.5% of the energy consumed in the EU came from renewable sources, reflecting the region’s ongoing transition toward cleaner energy.
- The EU’s renewable energy production and consumption have risen significantly over the past two decades, helping to steadily reduce greenhouse gas emissions since 1990.
Challenges and Future Targets
- Global CO2 emissions increased by 6% in 2021 as economic activity rebounded post-pandemic.
- Fossil fuel subsidies in 2020 reached $5.9 trillion, equivalent to $11 million per minute globally.
- The share of fossil fuels in electricity generation decreased from 68% to 62% between 2011 and 2021. Nuclear power fell slightly from 12% to 10%.
- To meet the targets of keeping global warming well below 2°C and pursuing efforts to limit warming to 1.5°C, there needs to be a significant increase in both renewable energy deployment and energy efficiency improvements by 2030.
- To reach the goal of limiting global warming to 1.5°C, the world must move away from using fossil fuels without carbon capture by mid-century at the latest.
- The world will need three times more renewable energy capacity by 2030, which amounts to at least 11,000 GW of renewable capacity.
- The global average annual rate of energy efficiency improvements must double from the current 2% to over 4% each year until 2030 to stay on track with the 1.5°C global warming target.
- To achieve net zero emissions by 2050, global clean energy investments will need to more than triple, reaching $4 trillion annually by 2030.
- By 2045, the widespread use of new low-emissions technologies is expected. Most cars on the roads will run on electricity or fuel cells, while planes will heavily rely on biofuels and synthetic fuels. Hundreds of industrial plants worldwide will use carbon capture or hydrogen technologies.
- By 2030, clean energy investments are projected to increase dramatically, reaching close to $4 trillion annually.
- The share of renewable energy used for transport in the EU grew from under 2% in 2005 to 8.7% in 2022, still 5.3 percentage points below the 2030 target.
Sources: EEA, IEA, COP28, REN21, EEA, NationalGeographic, PewResearch
Government Support and Policies
At the global level, many countries have introduced policies and targets that promote the adoption of renewable energy. From encouraging the use of EVs to regulating renewable energy deployment, government actions are influencing the speed and direction of the global energy transition.
Government Support for Energy Sources
- Fifty-one percent of Americans say the government should encourage the use of electric vehicles, while 39% are neutral.
- Opinions are split, with 35% of Americans favoring government encouragement for nuclear power, while 26% feel it should be discouraged.
- Thirty-three percent of U.S. adults think the government should encourage oil and gas drilling, but a similar percentage (33%) feel neutral about it.
- Forty-four percent of Americans believe the government should discourage coal mining, compared to 20% who believe it should be encouraged.
Global Renewable Energy Progress
- A total of 156 countries now have renewable power regulatory policies in place.
- Seventy countries have transport regulatory incentives or mandates focusing on renewable energy.
- Twenty-six countries have heating and cooling regulatory policies incentivizing or mandating renewable energy use.
- The number of countries with renewable energy regulatory policies for power increased significantly from around 90 in 2011 to 156 in 2021.
- Transport regulations for renewable energy have seen moderate growth, stabilizing at around 70 countries by 2021.
- Policies for heating and cooling remained more stagnant, reaching only 26 countries by 2021.
- One hundred thirty-five countries now have renewable power targets, and 156 countries have renewable power regulatory policies.
- There is a total of 3,146 GW of global installed renewable power capacity.
- In 2020, 12.6% of the world’s total final energy consumption came from modern renewables.
- The share of renewable energy in electricity generation increased by 8 percentage points over the past decade, from 20.4% in 2011 to 28.3% in 2021.
- In 2020, over 28% of the world’s electricity came from renewable sources, and this share continues to rise annually.
Sources: Ren21, Climate, PewResearch